
Debt issuance within the banking and finance sector saw a 6.3% decline in 2020 when compared to previous years, according to data provided by LMG Analytics’ debt capital markets service.
Other than the utilities sector, which saw a decrease by about half a percentage point, every other sector saw a rise in issuances last year, including transport, technology, oil and gas, construction and real estate.
In a year dominated by Covid-19, this is attributable to the wide-ranging financial implications of the pandemic.
“In the beginning, everyone in the banking sector was worried about credit being tight and went out and borrowed,” said Jeff Karpf, a partner in the capital markets team at Cleary Gottlieb. “In contrast to the travel, real estate or transport sectors, it quickly became apparent that banks needed less cash and liquidity than other sectors, unlike during the financial crisis, because they had better years.”
See also: IFLR's European in-house counsel summit 2021
This is evident in the pattern of bank lending, whereas banks borrowed early in the pandemic they quickly slowed to a reasonable pace.
“More importantly, the total dollar volume of debt capital markets increased significantly in 2020 from 2019,” continued Karpf. “In the US, once the Federal Reserve announced its backstop programme, borrowing became very cheap and easy.”
“Everyone piled in to borrow, so the financial sector ended up being a smaller percentage of the total debt capital market sector than it was in the prior year,” he added.
Transaction Sector |
2019 |
2020 |
Banking and financial services |
51.6% |
45.3% |
Real estate |
10.2% |
10.3% |
Construction |
5.3% |
5.7% |
Utilities |
5.6% |
4.9% |
Technology and telecommunications |
3.2% |
4.6% |
Transport |
3.6% |
4.1% |
Consumer goods and services |
2.8% |
4.0% |
Industrials and manufacturing |
2.6% |
3.2% |
Investment management and funds |
2.1% |
2.3% |
Oil and gas |
1.9% |
2.3% |
Liquidity
LMG Analytics’ primary focus is on the relationships between issuers, underwriters and the law firms that advise them. In addition to volume and value, the underlying data powers an analytics machine that measures the durability of firm/company relationships, the complexity of each deal in the database, and the market share for each company across multiple filters.
The data covers more than eleven thousand DCM transactions from 2020 alone, accounting for $6.06 trillion in bond sales.
As the data shows, many other sectors saw a marked increase in lending numbers.
According to John Meade, partner at Davis Polk, many of those borrowing in Q2 did so because of concerns that access to liquidity might become difficult. “Those that were around during the financial crisis would remember the disruption to the markets, in particular the commercial paper market,” he said. “People may not have expected quite the same disruption this time, but they presumably expected some tightening of liquidity.”
See also: Covid-19 spurs automation in financial-services
Transport was one sector that had a very active 2020. For example, airlines and the cruise ships borrowed because revenues had declined significantly, which goes some way to explaining the increased numbers there. “It was not because they were flying or cruising more, it was the exact opposite,” Meade added. “They were stocking up on cash in the hope that they would have enough to see them through the downturn.”
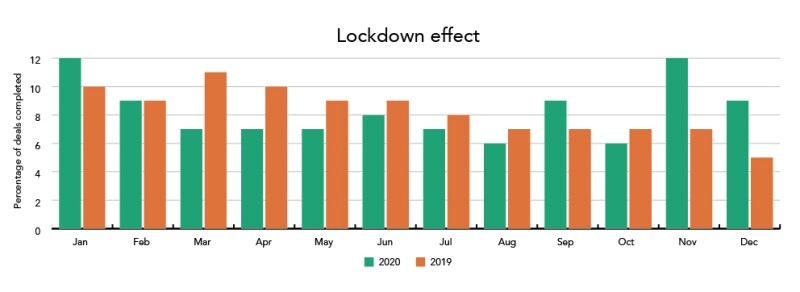
Covid-19 impact
The pandemic had an interesting effect on deal activity in 2020. While the first two quarters of 2019 saw a lot of activity, things tailed off in the second half of the year. As the coronavirus took hold, deals dropped off significantly and then stabilised at a base level for almost six months. According to the research, it was not until mid-August 2020 that there was an uplift, signalling a change in attitude towards deals. By November 2020, deals had hit their highest point since the beginning of the year.
In 2019, interest rates were low and firms borrowed heavily in the first half of the year before slowing down in the second. “Leaving aside Covid-19, nobody went into 2020 expecting it to be a heavy debt capital markets year,” said Karpf. “Everyone thought that interest rates might start going up, the US economy in particular was strong at the end of 2019.”When the pandemic started, and the Fed introduced its backstop, things picked up quite heavily for the second and third quarters of 2020.
See also: SRD2 lessons learnt from Covid-19 must not be forgotten
In March and early April, companies started to stockpile cash. In those initial weeks, when Covid-19 escalated dramatically for the first time, there was a clear concern that no one really knew what was around the corner.
“Corporate treasurers decided to take advantage of this and raise significant amounts of cash when the market was open, but then – as the data suggests – that subsided,” said Meade. “Later in the year, we saw less cash piling for a rainy day and more opportunistic refinancing.”
With 2021 already bringing surprises at every turn, who knows what story the data will tell this year.
The full report is available to download here.